上次物理实验做的是双偏振,实验资料中推荐使用 origin 画图,我既不想使用 Windows 也不想多下载一个软件,因此我打算用 matplotlib 画图。
代码
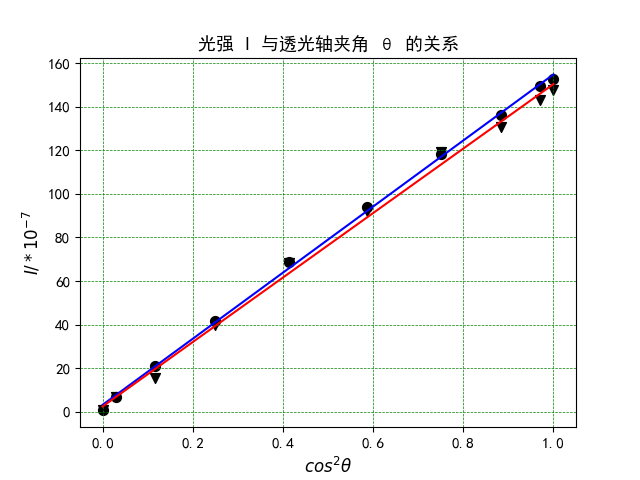
第一个实验画图是很简单的线性回归计算:
import numpy as np
import matplotlib.pyplot as plt
import math

plt.rcParams['font.sans-serif']=['SimHei']

angles = [90, 80, 70, 60, 50, 40, 30, 20, 10, 0]
x = []
for a in angles:
  x.append(math.cos(a / 180 * math.pi) ** 2)
y1 = [0.6, 6.8, 21.0, 41.8, 68.9, 94.1, 118.2, 136.1, 149.7, 152.8]
y2 = [0.6, 6.8, 15.7, 39.6, 68.4, 92.2, 119.2, 130.8, 142.9, 147.7]

x = np.array(x)
y1 = np.array(y1)
y2 = np.array(y2)

plt.scatter(x, y1, 50, "black", marker = "o")
plt.scatter(x, y2, 50, "black", marker = "v")

a1, b1 = np.polyfit(x, y1, 1)
a2, b2 = np.polyfit(x, y2, 1)

plt.plot(x, a1 * x + b1, "blue")
plt.plot(x, a2 * x + b2, "red")
plt.title("光强 I 与透光轴夹角 θ 的关系", fontsize = 13)
plt.xlabel('$cos^2θ$', fontsize = 12)
plt.ylabel('$I/*10^{-7}$', fontsize = 12)

plt.tick_params(labelsize = 11)

plt.grid(True, linestyle = "--", color = "g", linewidth = "0.5")
plt.savefig("lab1.png")
plt.show()
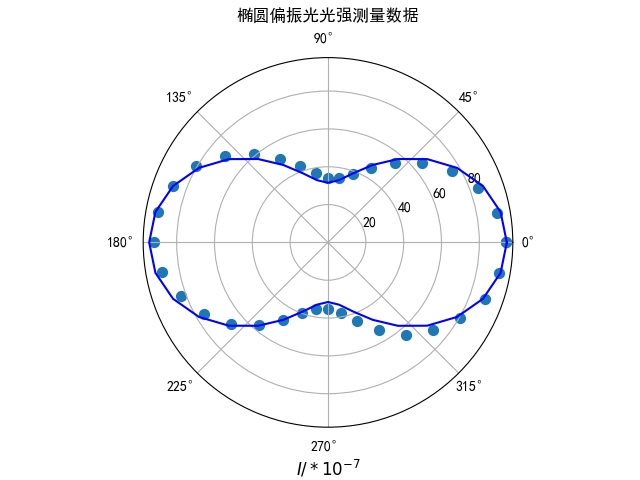
第三个实验画图使用了极座标系和极座标系上的拟合,需要查看 matplotlib 的 API :
import matplotlib.pyplot as plt
from scipy.optimize import curve_fit
import numpy as np

plt.rcParams['font.sans-serif']=['SimHei']

def form(x, A):
  res = A * A * 2 * (np.cos(x) * np.cos(x) * 0.75
                  + np.sin(x) * np.sin(x) * 0.25)
  return res

theta = []
for i in range(0, 360, 10):
  theta.append(i / 180 * np.pi)
I = [ 93.9, 90.7, 84.4, 75.6, 65.0, 54.9, 45.7, 38.5, 34.6,
      33.8, 37.0, 43.2, 51.0, 61.1, 71.0, 80.4, 87.1, 91.3,
      92.2, 88.9, 82.6, 75.8, 67.2, 56.8, 47.2, 39.9, 36.0,
      35.2, 38.1, 44.5, 53.4, 63.8, 72.2, 80.4, 88.2, 91.9 ]

# 为了最后封口
theta.append(theta[0])
I.append(I[0])

fig, ax = plt.subplots(subplot_kw={'projection': 'polar'})
plt.scatter(theta, I, 50, marker = "o")
plt.xlabel('$I/*10^{-7}$', fontsize = 12)
ax.set_title("椭圆偏振光光强测量数据", va = "bottom")

param, covariance = curve_fit(form, theta, I, method="trf")
plt.plot(theta, form(theta, *param), "blue")

plt.savefig("lab3.png")
plt.show()
在编写代码过程中发现,在form这个函数里只能使用 numpy 中的函数,而不能使用 math 中的函数,因为这个函数用于拟合,处理的是一堆数据组成的向量,必须要支持向量运算。
效果
参考
- matplotlib API Reference
https://matplotlib.org/stable/api/index.html
https://matplotlib.org/stable/gallery/pie_and_polar_charts/polar_demo.html
https://matplotlib.org/stable/gallery/lines_bars_and_markers/scatter_custom_symbol.html